BMI is a measurement of your body weight based on your height and weight. Although your BMI does not actually “measure” your percentage of body fat, it is a useful tool to estimate a healthy body weight based on your height. Due to its ease of measurement and calculation, it is the most widely used diagnostic indicator to identify a person’s optimal weight depending on his height. Your BMI “number” will inform you if you are underweight, of normal weight, overweight, or obese. However, due to the wide variety of body types, the distribution of muscle and bone mass, etc., it is not appropriate to use this as the only or final indication for diagnosis.

Body Mass Index Formula
The formulas to calculate BMI based on two of the most commonly used unit systems:
- BMI – weight(kg)/height2(m2) (Metric Units)
- BMI – 703 weight(lb)/height2(in2) (U.S. Units)
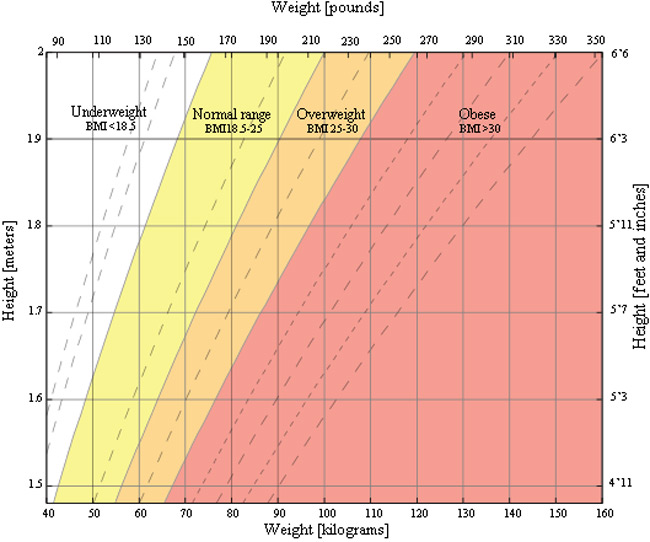
BMI Chart for Adults
This is a graph of BMI categories based on the World Health Organization data. The dashed lines represent subdivisions within a major categorization.

BMI Table for Adults
This is the World Health Organization’s (WHO) recommended body weight based on BMI values for adults. It is used for both men and women, age 18 or older.
- Category BMI range – kg/m2
- Severe Thinness < 16
- Moderate Thinness 16 – 17
- Mild Thinness 17 – 18.5
- Normal 18.5 – 25
- Overweight 25 – 30
- Obese Class I 30 – 35
- Obese Class II 35 – 40
- Obese Class III > 40
- BMI Table for Children and Teens, Age 2-20
The Centers for Disease Control and Prevention (CDC) recommends BMI categorization for children and teens between age 2 and 20.
Category Percentile Range
- Underweight <5%
- Healthy weight 5% – 85%
- At risk of overweight 85% – 95%
- Overweight >95%
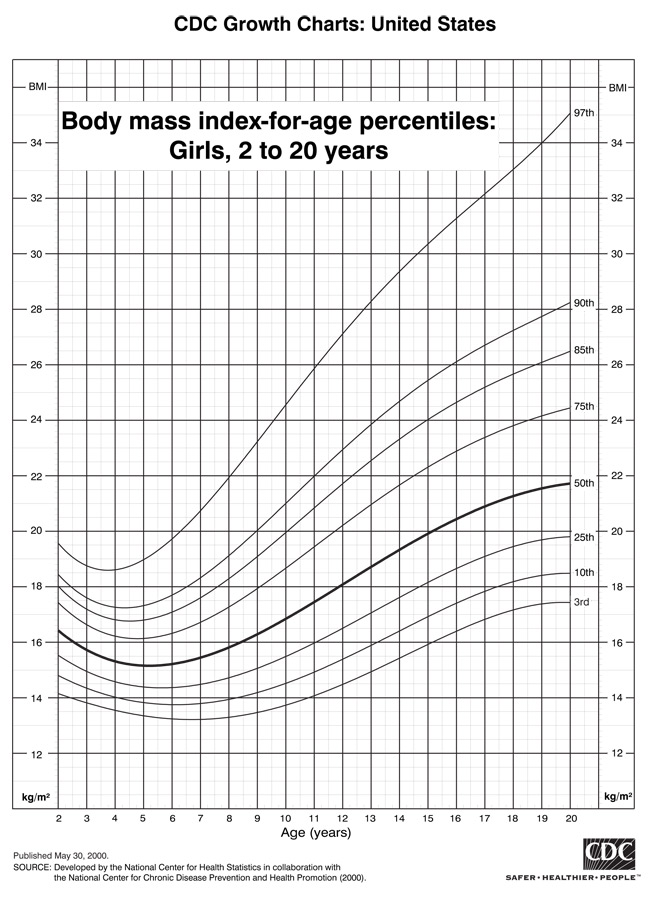
BMI Chart for Children and Teens, Age 2-20
The Centers for Disease Control and Prevention (CDC) BMI-for-age percentiles growth charts.

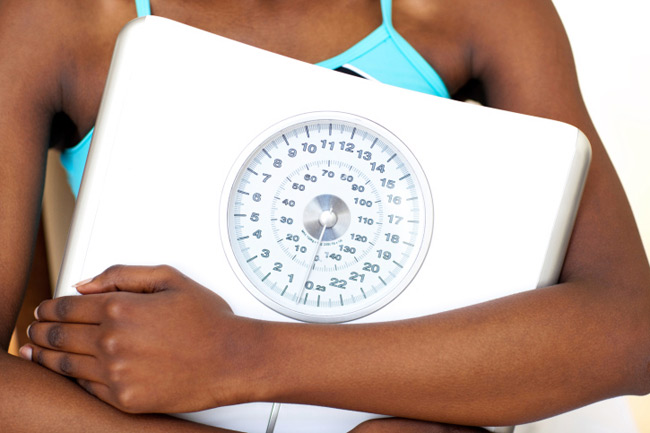
BMI calculator for women calculates body mass index from your Weight and Height and also shows how your weight compares to other women of the same height and age.
There is no such thing as a BMI calculator for men, but as the pictures show, men and women have different weight distributions. Women accumulate weight in the hips and buttocks, whereas Men tend to accumulate mass at the waist.
BMI calculator for women you also need to measure your waist.
The more your BMI calculation is, the greater is the risk for your health.
And the risk increases if your waist size is over 35 inches for women.
Risk of Associated Disease According to BMI and Waist Size:
The table below helps you to verify health risks as compared to normal weight.
BMI Waist less than 35 in Waist greater than 35 in
- 18.5 or less Underweight – –
- 18.5 – 24.9 Normal – –
- 25 – 29.9 Overweight Increased High
- 30 – 34.9 Obese High Very High
- 35 – 39.9 Severely obese Very High Very High
- 40 or more Extremely obese Extremely high Extremely high
Being overweight or obese isn’t a cosmetic problem. These conditions greatly raise your risk for other health problems.
What to do to improve a women BMI
If your BMI calculation is over 25, then losing weight would significantly improve your health. One of the most successful ways to manage your diet and lose weight is to keep a food diary.
How is BMI used?
BMI is used as a screening tool to identify possible weight problems for adults. However, body mass index is not a diagnostic tool. To determine if excess weight is a health risk, a healthcare provider would need to perform further assessments. These assements may include skinfold thickness measurements, evaluations of diet, physical activity, family history and other appropriate health screenings.

Why use BMI to measure overweight and obesity?
Calculating BMI is one of the best methods for population assessment of overweight and obesity. Because the calculation requires only height and weight, it is not costly and it’s simple to use for clinicians and for the general public. The use of BMI allows individuals to compare their own weight status to that of the general population.
What are some other ways to measure obesity?
Other ways to measure obesity are skinfold thickness measurements, calipers, underwater weighing, bio electrical impedance, dual-energy x ray absorptiometry (DXA), and isotope dilution. However these methods are not always readily available, they are either expensive or need highly trained personnel.
How reliable is BMI as an indicator of body fatness? The correlation between the BMI number and body fatness is fairly strong. However it varies by gender, race, and age. These variations include: At the same BMI, women tend to have more body fat than men. At the same Bmi, older people, on average, tend to have more body fat than younger adults. And highly trained athletes tend to have a high BMI because of increased muscularity rather than increased body fatness.
What is considered a healthy BMI?
Between 20 and 25.
What does your BMI mean?
BMI under 18.5 – is considered very underweight and possibly malnourished, 18.5-24.9 – you have a healthy weight range for young and middle-aged adults, 25.0 to 29.9 – you are overweight and over 30, you are considered obese.
What are some exceptions to the rule?
BMI does not differentiate between body fat and muscle mass. This means there are some exceptions to the BMI guidelines.
What are the health consequences of overweight and obesity for adults?
Hypertension, dyslipidemia, type 2 diabetes, coronary heart disease, stroke, gallbladder disease, osteoarthritis, sleep apnea and respiratory problems, and some cancers including endometrial, breast, and colon.
Is BMI interpreted the same way for children and teens as it is for adults?
Yes, but however, the criteria used to interpret the meaning of the BMI number for children and teens are different from those used for adults. For children and teens, BMI age, and gender-specific percentiles are used for two basic reasons: 1) the amount of body fat changes with age, and 2) the amount of body fat differs between boys and girls.

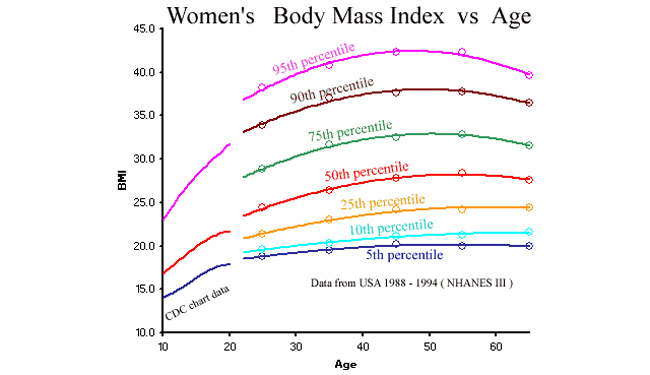
Body mass index chart for Women
A chart showing the Body Mass Index of Women, changing with age.
Notice the “median” BMI value, which is the 50th percentile Red line. Compare it to the CDC definition of “Overweight” at BMI of 25. This is where the experts derived the famous statistic, that over 50 percent of American Women have a BMI over 25 and hence are considered overweight.
Also notice the gradual increase in Women’s body mass index over time, until age 50-60. After that, a gradual decrease in BMI occurs in older women. Each percentile line has a curved shape, even for skinny women at 25th and 10th percentiles. (That a curved line is better model than a flat line across BMI-25. That some weight gain during adult life is “natural”.)
The chart shows how girls BMI increases with age, even beyond age 20. The children’s data came from the standard CDC growth charts. There is a gap between the children’s and adult data, because the data sources are different. The adult data (from the NHANES III survey) is more recent ( 1988-1994 ), whereas the body-mass-index-for-age charts from the CDC are based from a mix of data from old and recent sources.
At less than 50th percentile, men have a higher BMI than women, which is generally thought to be due to men’s greater skeletal muscle mass. But after age 30, for the 50th percentiles or higher, overweight women rise to higher BMI levels than men. Probably because if a woman is going to be overweight, her body accumulates fat in breasts and hips, which are places that men’s fat accumulation doesn’t occur. This female trait probably explains the higher BMI levels in overweight women.
Check your BMI at: http://www.womenfitness.net/bmi.htm
Videos
https://youtube.com/watch?v=Lpha3AoUcwQ
Disclaimer
The Content is not intended to be a substitute for professional medical advice, diagnosis, or treatment. Always seek the advice of your physician or other qualified health provider with any questions you may have regarding a medical condition.


